


Solar Power Project Excel Financial Model


Original price was: $125.$95Current price is: $95.
The Solar Power Project Excel Financial Model is a user-friendly, customizable tool for analyzing costs, forecasting cash flows, and evaluating profitability in solar projects. It includes revenue analysis, loan amortization, financial statements, and risk assessment—ideal for developers, consultants, and investors aiming to make informed, data-driven decisions in the renewable energy sector.
Frequently Bought Together
- Description
- Reviews (7)
- Testimonial
- Case Study
Description
Solar Power Project Excel Financial Model
The Solar Power Project Excel Financial Model is a powerful, structured tool developed specifically for project developers, consultants, and investors in the renewable energy sector. Whether you’re planning a utility-scale solar plant, a solar power tower, or a smaller-scale solar system, this model gives you a clear path to understanding your project costs, revenue forecasts, and long-term return on investment.
If you’re trying to make informed investment decisions or present your case to banks, equity investors, or energy off-takers, this model offers a fully linked and intuitive cash flow model. It’s ideal for new solar ventures or established players evaluating a new power project financial model.
Let’s break down each part of the model and see how it provides a detailed, end-to-end financial framework for your solar energy investments.
Part: Key Components
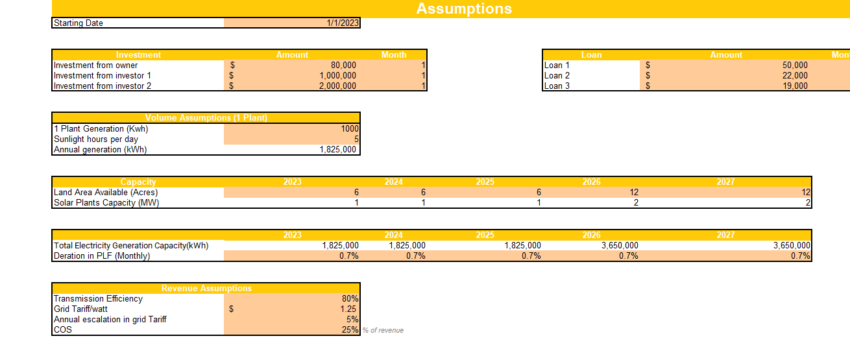
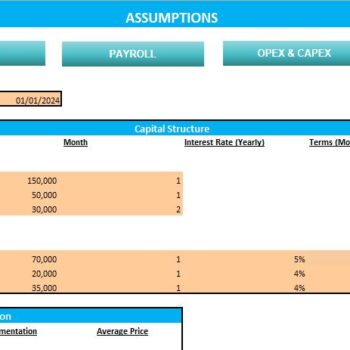
Input Sheet
This is where everything begins. The Input Sheet sets the assumptions that feed every calculation across the model.
- Project Timeline: Define your construction period, operation start date, and project duration.
- Solar Resources: Input solar irradiance data to estimate power generation from your solar panels or solar power towers.
- Tariff / Customer Rate: Set your energy bid prices or Power Purchase Agreement (PPA) terms.
- Operating Expenses: Detail monthly/annual operational costs, including maintenance, insurance, and administrative overheads.
- Capital Expenditures: Capture all your construction costs, procurement, and engineering expenses.
- Debt Assumptions: Customize interest rates, debt repayment schedules, and balloon payments.
- Equity Contributions: Adjust cash equity injections and shareholder returns.
The Input Sheet is clear, interactive, and uses dropdowns and spinner boxes to make complex modeling accessible—even for non-finance users.
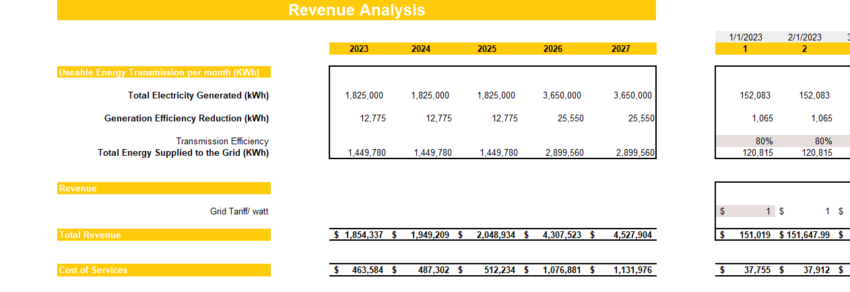
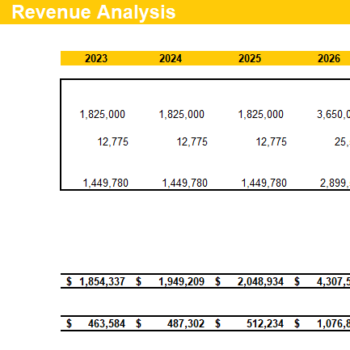
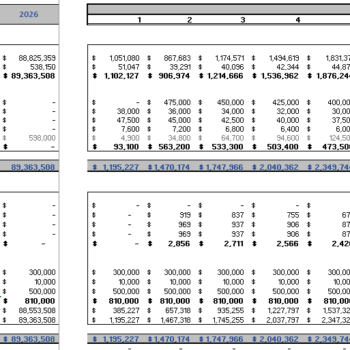
Revenue Analysis
Understanding your revenue streams is key to predicting project performance.
- Energy Production: Model annual output based on solar resources, degradation rates, and system losses.
- Tariff Assumptions: Capture escalation clauses, customer rate changes, and subsidy-influenced pricing.
- Other Income: Account for solar incentives and tax incentives such as Investment Tax Credits or accelerated depreciation benefits.
Revenue is calculated monthly and summarized annually to give you a realistic sense of your cash-generating ability over time.
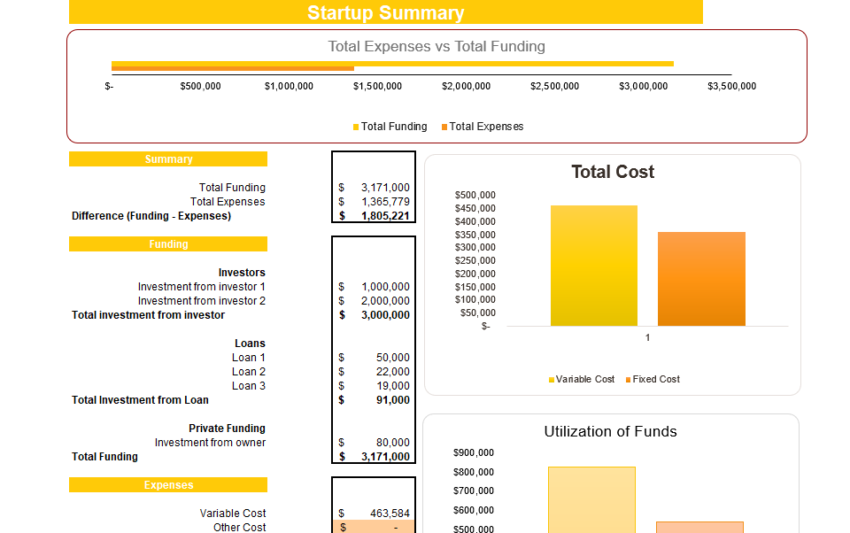
Startup Summary
This section outlines the upfront cost to launch your solar project and defines your sources of capital.
- Initial Cost Breakdown: Includes land, engineering, permitting, procurement, and cost of panels.
- Capital Structure: Shows how basic financing structures—debt vs. equity—cover total project costs.
- Development Process Costs: Tracks legal, consultant, and feasibility fees.
- Working Capital: Ensures sufficient buffer for the first few months of operation.
This helps solar owners present a detailed investment summary to stakeholders and lenders.
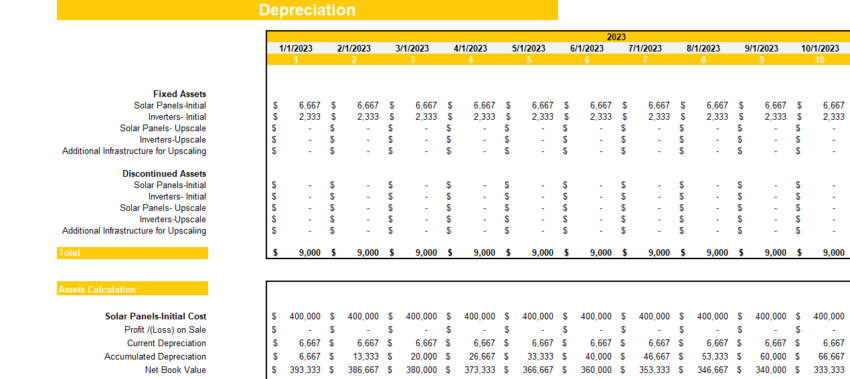
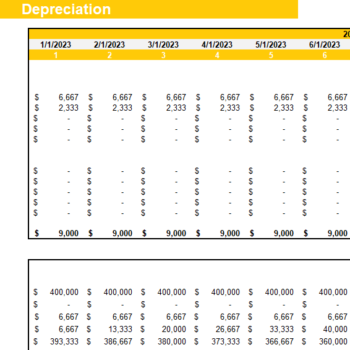
Depreciation and Amortization Schedule
This schedule ensures your balance sheet balances by recognizing asset devaluation.
- Depreciation: Based on MACRS or straight-line methods, this accounts for tangible assets like solar panels, inverters, and racking systems.
- Amortization: Covers intangible assets such as development rights or software used in physical operations.
These are vital for understanding tax savings and aligning the model with tax decisions.
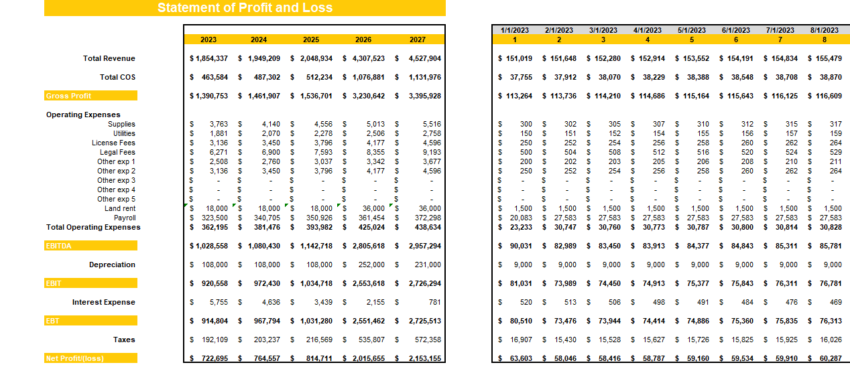
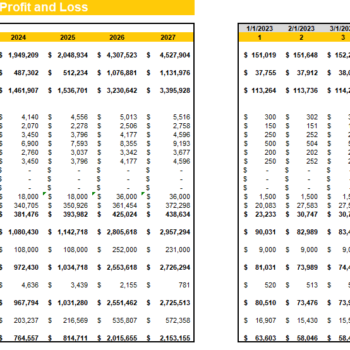
Income Statement
The Income Statement gives you a clear view of your project’s profit potential over time.
- Revenue Recognition: Monthly and annual views of total revenue.
- Cost of Goods Sold (COGS): O&M costs, inverter replacements, and insurance.
- Operating Expenses: Legal, admin, and Business Expenses.
- Net Profit: After depreciation, interest, and tax.
This statement is automatically updated as you tweak inputs, giving you instant insight into your financial health.
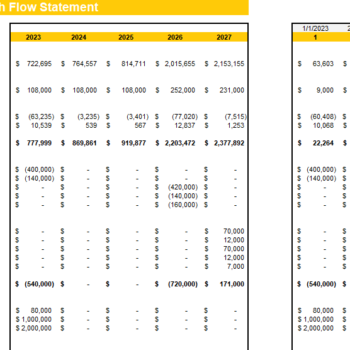
Cash Flow Statement
Cash flow is king—this sheet shows whether the project can meet its cash sweeps, obligations, and distributions.
- Cash from Operations: Shows inflow from power sales and subsidies.
- Investing Activities: Captures capital expenditures and major replacements.
- Financing Activities: Tracks equity, debt repayment, interest, and dividend payments.
This is a must-have for lenders and equity investors to assess cash flows and potential liquidity gaps.
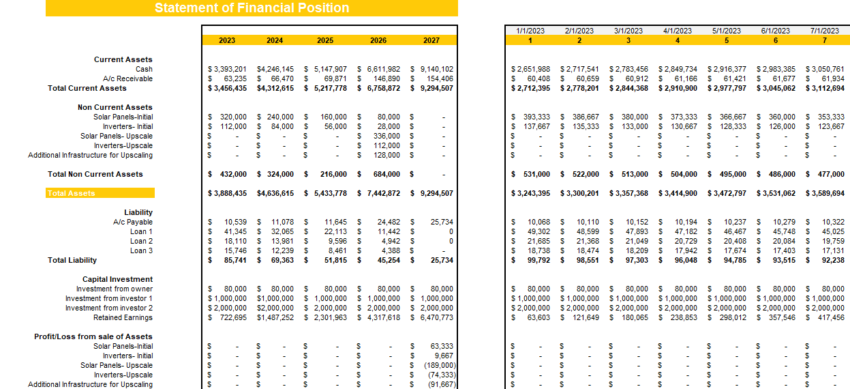
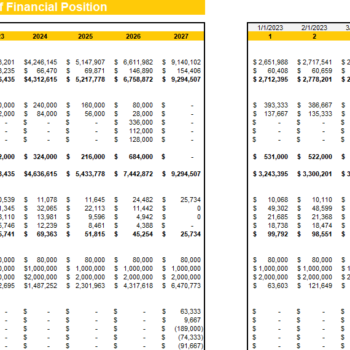
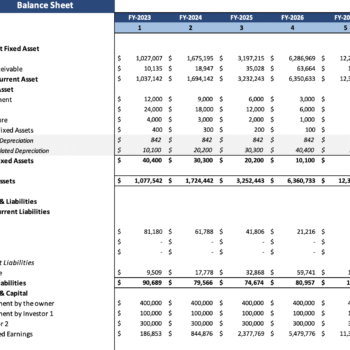
Balance Sheet
The Balance Sheet offers a snapshot of your financial position.
- Assets: Solar systems, inventory, prepaid expenses, and cash reserves.
- Liabilities: Outstanding loans, accrued interest, and tax obligations.
- Owner’s Equity: Reflects initial investment, retained earnings, and distribution history.
Each item links back to the core assumptions to ensure balance sheet components reflect actual operations.
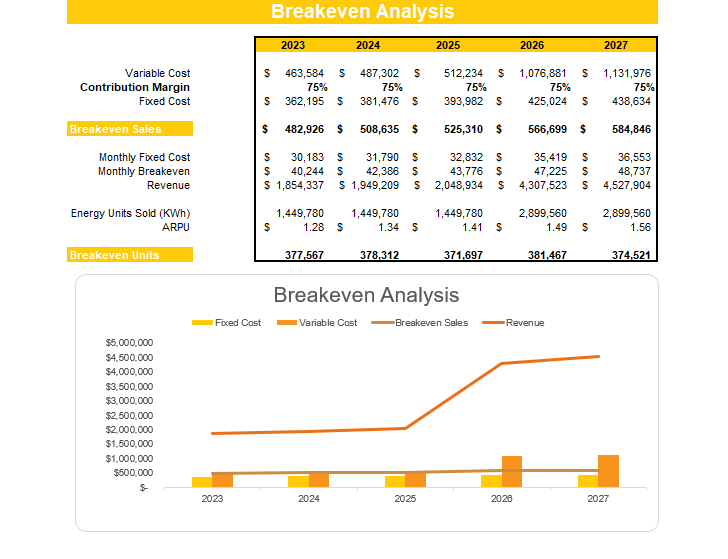
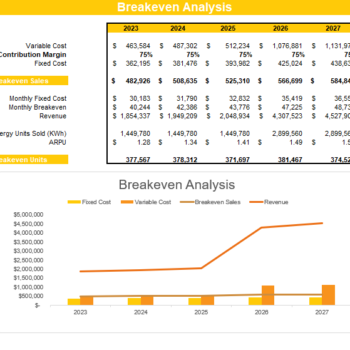
Breakeven Analysis
Knowing when you cover your costs is critical—this sheet calculates your Payback Period.
- Fixed and Variable Costs: Includes depreciation, O&M, and interest.
- Revenue Targets: Tells you how many kWh must be sold to cover costs.
- Time to Break Even: Shows the exact year and month when breakeven occurs.
This helps identify whether your solar energy investment is delivering attractive returns.
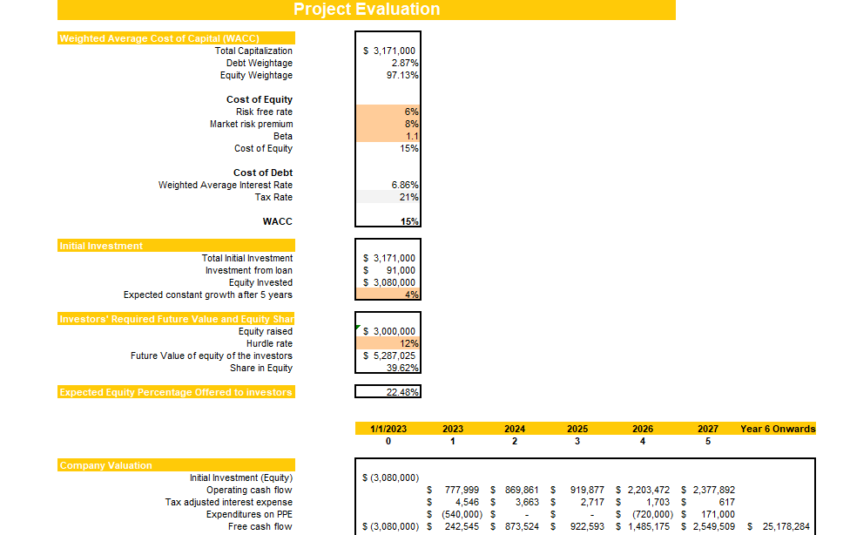
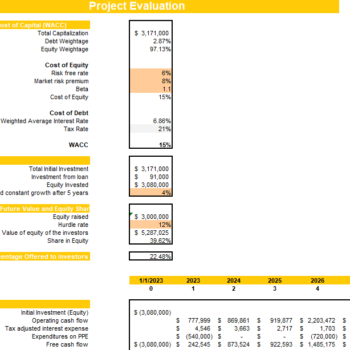
Project Evaluation
This section quantifies whether the project is worth pursuing using financial metrics.
- Net Present Value (NPV): Projects long-term cash benefits in today’s dollars.
- Internal Rate of Return (IRR): Calculates the rate that makes NPV zero.
- Equity IRR vs. Project IRR: Separates capital structure returns from total project return.
- Profitability Index: Shows ROI per dollar invested.
It also accounts for potential risks and rewards to ensure you’re making a compelling decision.
Sensitivity Analysis
This lets you test how changes in key variables affect profitability.
- Scenario Analysis: Run best case, base case, and worst case.
- Input Variations: Adjust energy prices, construction costs, or output levels.
- Graphical Outputs: See how small changes ripple through the model.
This kind of sensitivity analysis helps manage uncertainty and guides your risk assessment process.
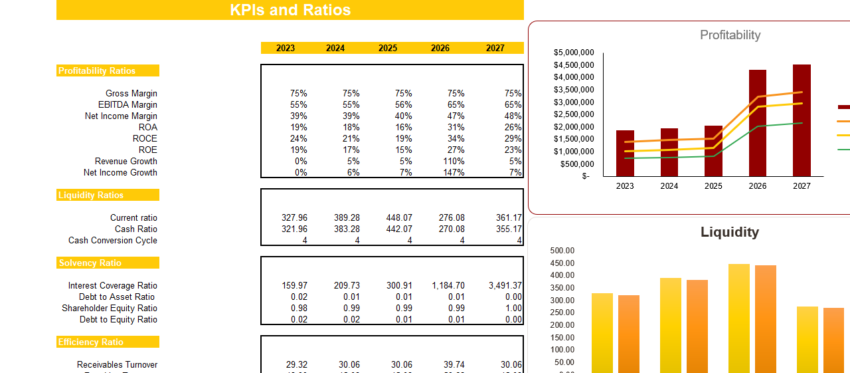
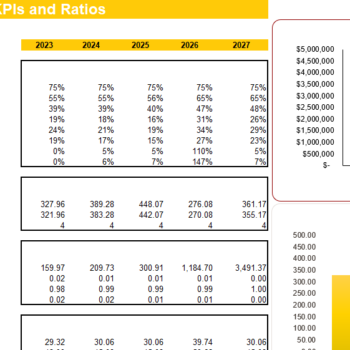
KPIs and Financial Ratios
Monitor business health with built-in metrics and key performance indicators.
- Profitability Ratios: IRR, net margin, EBITDA margin.
- Liquidity Ratios: Current ratio, cash runway.
- Efficiency Ratios: Revenue per MW, capex per watt.
- Debt Service Coverage Ratio (DSCR): Tests your ability to service loans.
These help investors evaluate your solar investments against traditional energy sources or other renewable resource opportunities.
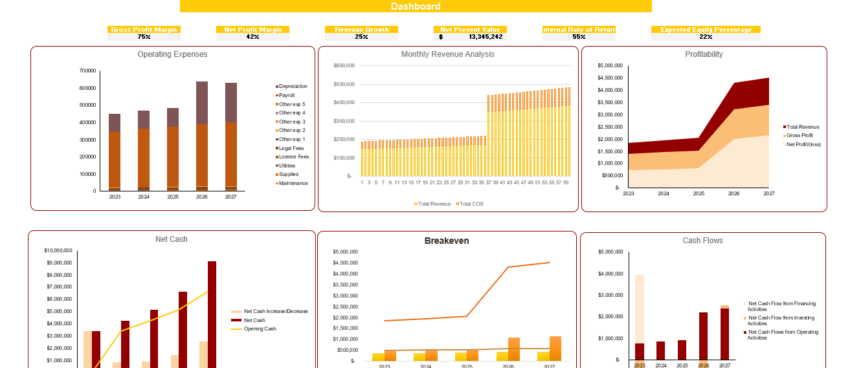
Dashboard
The financial model dashboard turns raw data into visual, executive-level insights.
- Cash Flow Graphs: Visualize inflows, outflows, and net position.
- IRR Charts: Show base case and stress-tested outcomes.
- Debt vs. Equity Pie Charts: Illustrate the financing structure.
- Payback and Breakeven Visuals: Instantly show time-based performance.
This view is perfect for presentations, board meetings, or quick decision-making by business owners.
Part: FAQs
Who is this model for?
This model is ideal for developers, consultants, investors, or any solar owners evaluating a new solar project finance model. It supports both small and utility-scale renewable energy projects.
What financial techniques does this model use?
It uses proven financing techniques including basic financing structures, consolidated financing, and full support for debt repayment schedules, cash sweeps, and investor returns.
Can this model support government incentives and subsidies?
Yes. It fully accommodates tax incentives, solar incentives, accelerated depreciation, and subsidy income streams that influence actual revenue.
How accurate is this financial model?
The model eliminates circular references and uses time-tested formulas for cash flows, IRR, NPV, and financial statements to ensure consistency and reliability.
What if energy prices or interest rates change?
Use the sensitivity analysis and scenario analysis features to explore how changes in inputs like customer rate, output, or cost impact the model’s outcome.
This Solar Power Project Excel Financial Model isn’t just a spreadsheet. It’s a comprehensive tool designed to help you plan smarter, model accurately, and communicate effectively with stakeholders. It gives you the structure you need to reduce project financial uncertainty and increase investor confidence.
Terms of Use
Oak Business Consultant’s financial model templates are not officially affiliated with any specific software or platform unless stated. Your purchase grants a single license for personal or business use—redistribution, resale, or sharing is strictly prohibited. If you wish to recommend our product, please direct others to our shop.
Note
As this is a digital Excel file, returns or exchanges are not available. Please ask any questions before purchasing—we’re happy to assist!
Walk-Through Video of Solar Power Project Excel Financial Model
The following video will give you an overview of the different components of the financial model and will help you understand it’s working.
7 reviews for Solar Power Project Excel Financial Model
Add a review
You must be logged in to post a review.
Testimonial
Don’t just take our word for it! Hear from our satisfied customers who have benefited from our model. We’re proud to have empowered many solar project developers and investors with our comprehensive financial model. Please take a moment to look at our glowing testimonials.

Case Study
Our ‘Solar Power Project Excel Financial Model’ isn’t just theoretical – it’s proven in practice too. Delve into our ‘Startup Renewable Energy Business Financial Model‘ to see real-world examples of how our financial model has transformed the planning, financing, and execution of solar power projects.
If you’re ready to unlock your solar project’s potential, don’t wait. Oak Business Consultant is here to provide you with our advanced and user-friendly Financial Models. Get in touch with us today, and let us help illuminate the path to your project’s success!


Sulem Brim –
It has become an essential tool for our solar project feasibility studies.
Daniel Carter –
This template exceeded our expectations. The built-in metrics for IRR and ROI are invaluable for presenting to investors, and the customization options allowed us to tailor it perfectly to our project’s needs. Five stars
Sophia Turner –
The Solar Power Project Financial Model is a lifesaver. It’s incredibly detailed yet easy to use, even for someone with limited financial expertise.
Ethan Williams –
This model is perfect for solar project planning! It gave us detailed insights into profitability, ROI, and payback periods. The scenario planning feature was particularly helpful in analyzing different pricing structures.
Clarence Jenkins –
Outstanding tool for solar projects! Makes financial modeling an easy job. Accurate and user-friendly. Highly recommend
Johnny Cox –
Brilliant financial model for solar power. It’s detailed, easy to navigate, and extremely accurate.
Roy Smith –
Makes solar project financial planning simple and precise. A top-quality tool that I highly recommend